

Sometimes, you just have more data than you want to display all at once. Maybe you want to be able to filter it, but when you un-filter, you still want to restrict the total number of records you display. In that case, you might want to be able to specify a default set of data, so that your users get a sensible subset of your data in a readable format.
I used this technique recently in my interactive resume, where I wanted to allow users to search and display data from any of my past ventures, but when they weren’t explicitly interacting with the timeline, I just wanted to show my university education and my most relevant four jobs. In that case, the format of the dashboard/resume really didn’t allow for more than 5 records to be displayed comfortably, so I wanted to make sure that my users saw only the most relevant information.
Using Tableau, you can specify a default set of records to display, and set up your dashboard filter to use it.
Limitations of this method
The method I’ll show you, below, is only good for cases where a filtered result set is smaller than the total number of records you want to display. For a demonstration, I’m using a list of fruit of different colors, which you can filter on a dashboard. In this case, the number of fruits of each color should be less than the size of the default set, otherwise the filters won’t work as intended. In pseudocode:
size ( any filtered set ) <= size ( default set )The data set
In this example, I’ve used a list of 10 fruits, their descriptions and their colors. I’ll use the colors to filter the fruits on a dashboard, but I only want to display a default set of 5 of them when the color filter is off.
Here’s my data:
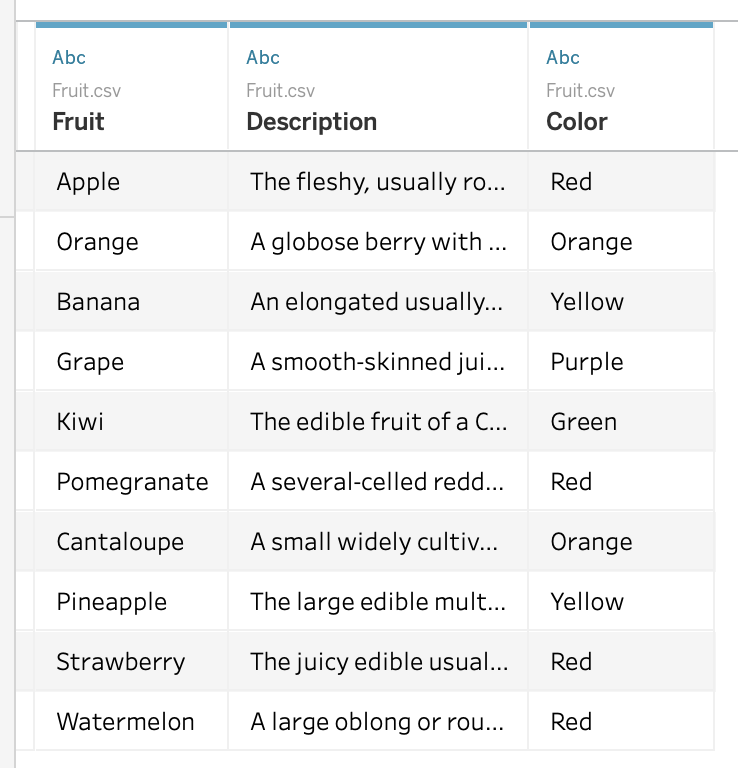
A simply fruity data set
(Feel free to download it for yourself!)
I want to specify a default set of fruit:
Apple
Banana
Grape
Orange
Strawberry
To make this default set work with our color filter, we need to take the following steps:
Create a set that includes just the default values
Create a boolean calculated field to judge whether we should display the normal values or default values
Set up our filter as a context filter
Get set and set up the default set
In Tableau, create a new set called “Default Fruit” from the Fruit dimension that looks something like this:
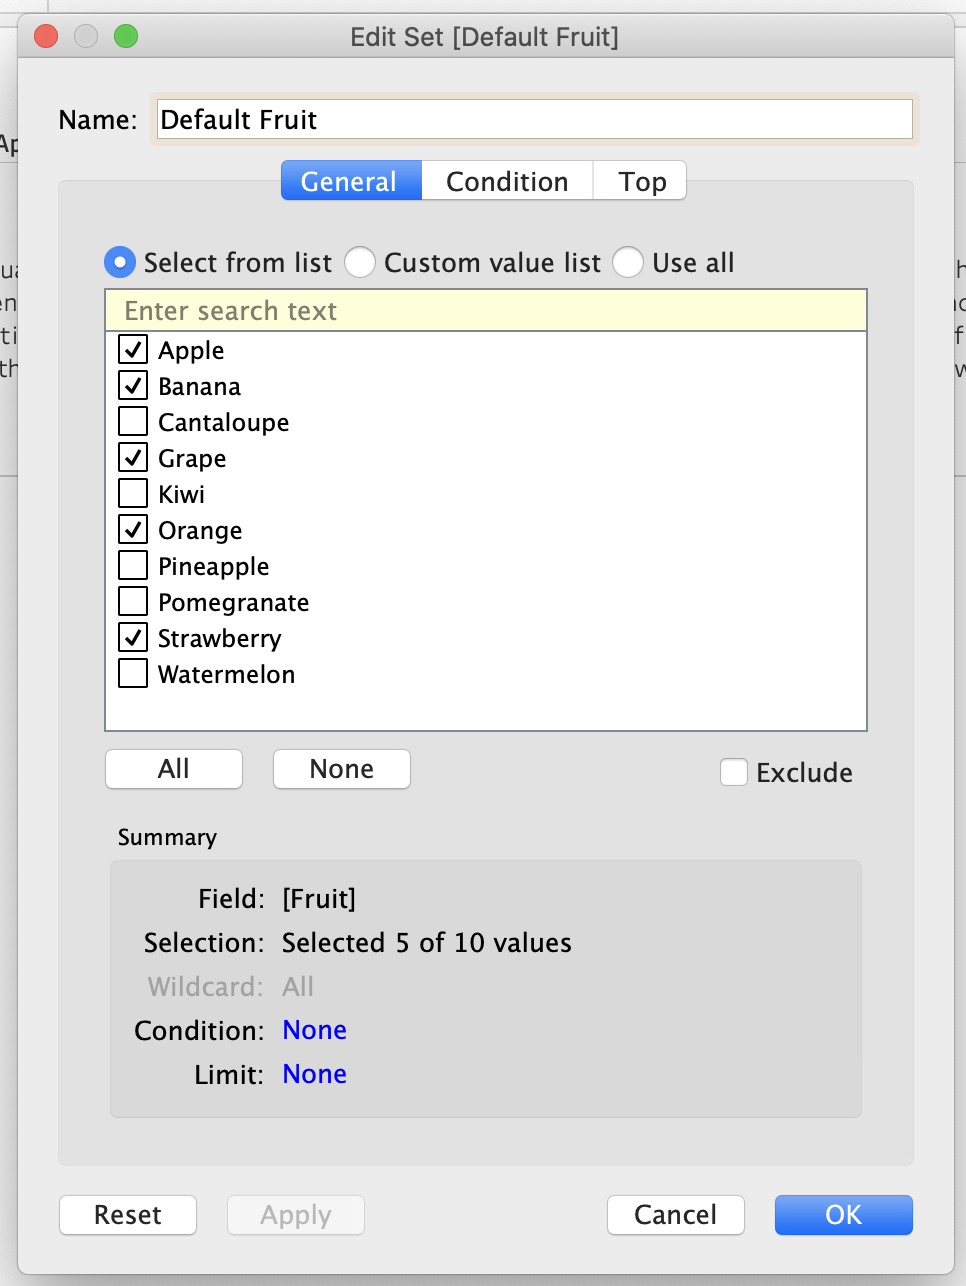
Set up the Default Fruit set in Tableau
Create the boolean calculated field and use it as a filter
Next, create a boolean calculated field that checks how many records you have. If it’s higher than your threshold, then it’s true when something’s in your default set and false otherwise. If the number of records you have is less than or equal to the threshold, then it’s always true.
IF { COUNT([Fruit]) } > 5
  THEN [Default Fruit]
  ELSE TRUE
END
Note the use of the fixed level of detail (LOD) calculation on COUNT([Fruit]). That’s to ensure that it’s counting the number of records at the highest level of detail after the context filter (which comes next).
Set up the color filter as a context filter
For this part, set up a dashboard with two sheets.
The first sheet is simply a listing of colors, with nice big marks to look like buttons:

Nice, big buttons!
Then on a dashboard, set the big buttons sheet up as a filter:

Use the big colored buttons as a filter
Then (and this is the most important part!), make sure to go into the Fruit worksheet and make the Color filter action into a context filter by right-clicking on the filter pill and clicking “Add to context”:

Context filters are your friends!
If you’re not very up on your context filters vs. LOD calculations, start with the Tableau help page!
Et Voilà!
Your default set should work. Remember, if your filtered sets are bigger than your default sets, this method won’t work as intended. Otherwise, this is a really handy way to control the formatting of a dashboard with a lot of information on it!