Author’s note: I wrote this tutorial for a specific application (triangular numbers, see below) but you can use the 2-record seed method for any use case where you need to densify a data set, but you don’t want to use the static “join to a text table of numbers” method.
I recently attended my first Tableau Conference, TC24 in San Diego, April 29 - May 1, 2024. I learned a lot, had a lot of fun, and was inspired by being immersed in a conference with thousands of data-lovers for 3+ days. I’d been kicking an idea around in my head for a few weeks: how to visualize triangular numbers.
You see, I’d only just learned about triangular numbers because I was trying to figure out just how many kettlebell swing ladders I was doing when I was going up and back to 20 reps. I looked up “factorials”, or 1 * 2 * 3 … (n-1) * (n), and eventually got to “triangular” numbers, or 1 + 2 + 3 … (n-1) + (n). I knew that there had to be a way in Tableau to:
work out the sum of a triangular number, and
visualize what that number looks like in an actual triangle.
The problem was: I knew that in order to do a viz like this, I was going to need a data set that could expand with a user selection, since a triangular number of 10 (4 rows) would have 10 marks, but a triangular number of 210 (20 rows) would have 210 marks. I could use a static data set, but then my viz would be limited by the incoming data set, rather than user selection, which just wasn’t gonna work for me.
On Day 1 of Tableau Conference, I asked my friend Gemma whether she knew of a way I could create a small data set and have it expand the number of rows based on user input. I don’t think she understood the question, because Gemma’s an incredibly talented vizzer and her face was a blank space (that’s a Taylor Swift reference; you’re welcome, Gemma).
Setting up the seed
I knew from previous explorations into table calc-based data densification that there was a way to use table calcs to expand a data set. But I couldn’t really remember how to do it. I spent Day 2 of Tableau Conference on the first part of the setup:
Create a “seed” data set with 2 records
Here’s my data set, which I guessed would probably work (spoiler: it did, eventually):
Sequence
Start
End
To get this into Tableau (I originally did this on Desktop Public 24.1), I simply typed this into my Notes app and copied/pasted it onto a blank sheet. It looked like this:
Tableau Public with a 2-record seed copied and pasted in as a data source
Create a parameter where users can type in a number
You probably already know how to do this. I called mine “Type a Number > 0” and made it an integer, with “All” allowable values.
Configuration for the "Type a Number > 0" parameter
Create a calculated field ranging from 1 to the user-entered value
Let’s call it [Point], and use a simple IIF() to set the values based on the existing [Sequence]:
IIF([Sequence] = 'End', [Type a Number > 0], 1)The formula for my calculated field [Point]
…and now for the fun stuff…
Set up [Point] bins and turn on domain padding
To see how this next part works, I recommend starting with a basic text table and building it out step by step.
Here I've made use of [Measure Names] and [Measure Values] to set up a text table I can add to
The first step is to set up bins on the measure [Point]. You can do this by right-clicking and going to Create > Bins…
Create bins on the measure [Point]
Overtype Tableau’s recommended bin size with 1, and press OK. The field [Point (bin)] now shows as a dimension in the Data pane.
Configuration for the bins on the [Point] measure
Note that [Point (bin)] is a new dimension in the data pane
To turn on domain padding, replace the [Sequence] pill currently on rows with the [Point (bin)] dimension. Then right-click on the [Point (bin)] pill and enable “Show Missing Values”.
How to find the “Show Missing Values” aka domain padding option
When you do this, you’ll see [Point (bin)] expand to show 1, 2, 3…19, 20. But [Point] is blank for values other than 1 and 20.
After showing missing values on [Point (bin)], the [Point] measure mostly looks blank.
Curse a little, then figure out how to use bins in calculations in Tableau
Once you have the bins expanded, it’s time to start mathing, right? Let’s try it out with a basic function in a new calculated field called [Point - Filled], which we’ll just point to [Point (bin)]:
Tableau doesn’t like you using bins in a calculated field!
You can try a bunch of variations on this but long story short: you can’t use a “bin” field directly in a calculated field in Tableau.
Enter this excellent blog on a similar technique to mine, which gave me the puzzle piece I needed: while you can’t do direct calculations on bins, you can use the INDEX() table calculation to do the same thing, provided your bins are 1 to n, like INDEX() is. Just a quick editing of a new pill in the Measure Values card will show you what this looks like (to avoid ambiguity, I have INDEX() calculating on [Point (bin)]):
See how INDEX() along Point (bin) lines up neatly with [Point (bin)]?
This means wherever I want to use [Point (bin)] in a calculation, I can use INDEX() instead.
One more point of nuance here: later in my “Triangular Numbers” dashboard, I did some work using constants. For example, I’m going to use:
a = 1But if I drag [a] into my table, it again doesn’t show for all rows.
A constant value doesn’t automatically show for all rows. It needs a little help
If you truly want to show a constant here, you still need to use INDEX() so the calculation is aware of the whole table. Anything divided by itself is 1, so if I instead use:
a = INDEX() / INDEX()…the constant shows for all rows.
Using INDEX() / INDEX() as a constant works better than using 1
You won’t always need to use this trick for constants; as long as that INDEX() is somewhere in the calculation you’ll be fine. For example, if a = 1 but a_2 = a + INDEX(), you get this result:
As long as INDEX() is in there somewhere, you’re good
Recap: Setting up the 2-record seed
Create a “seed” data set with 2 records
Create a parameter where users can type in a number
Create a calculated field ranging from 1 to the user-entered value
Set up [Point] bins and turn on domain padding
Use INDEX() (calculating on [Point (bin)], if needed, in calculations
Visualizing triangular numbers
In order to plot a triangular number T with its T marks in a triangle formation, we need to determine the ROW of each mark (the y-axis) and the COORD or coordinate of each mark (the x-axis). Enter: GCSE MATHS!
First, the ROWs
For any triangular number (or candidate):
T_n = 0.5 * n * (n + 1)…where n is the number of rows, aka the nth term in the triangular number sequence. If you want to find n, or the ROW of any mark, you can rewrite this equation as a quadratic equation:
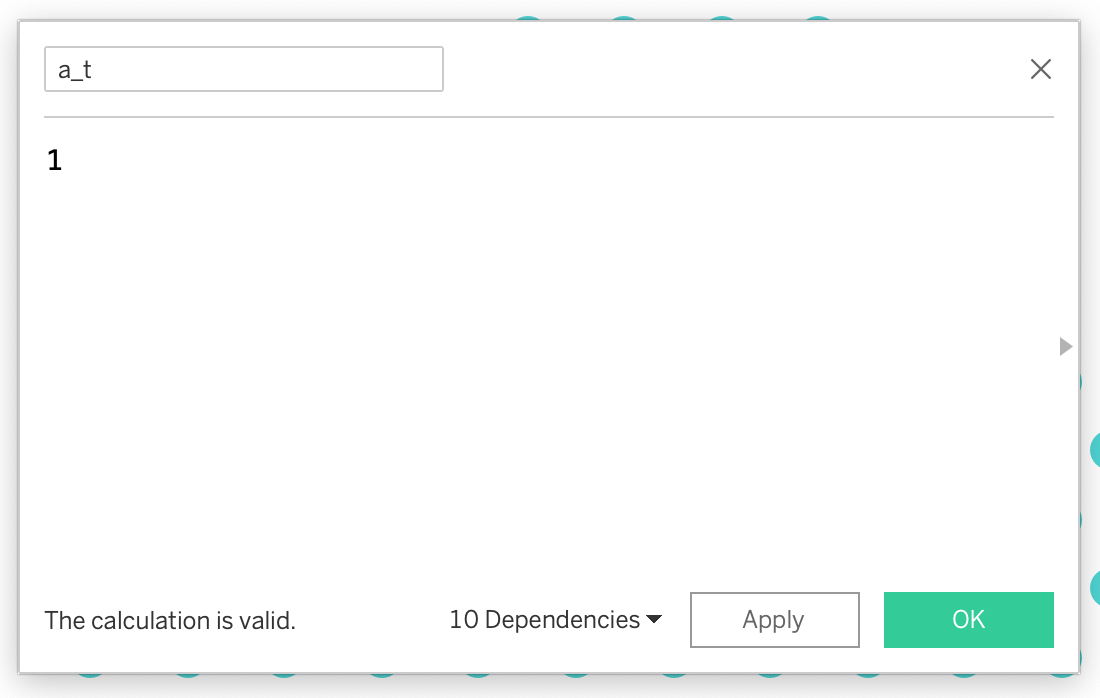
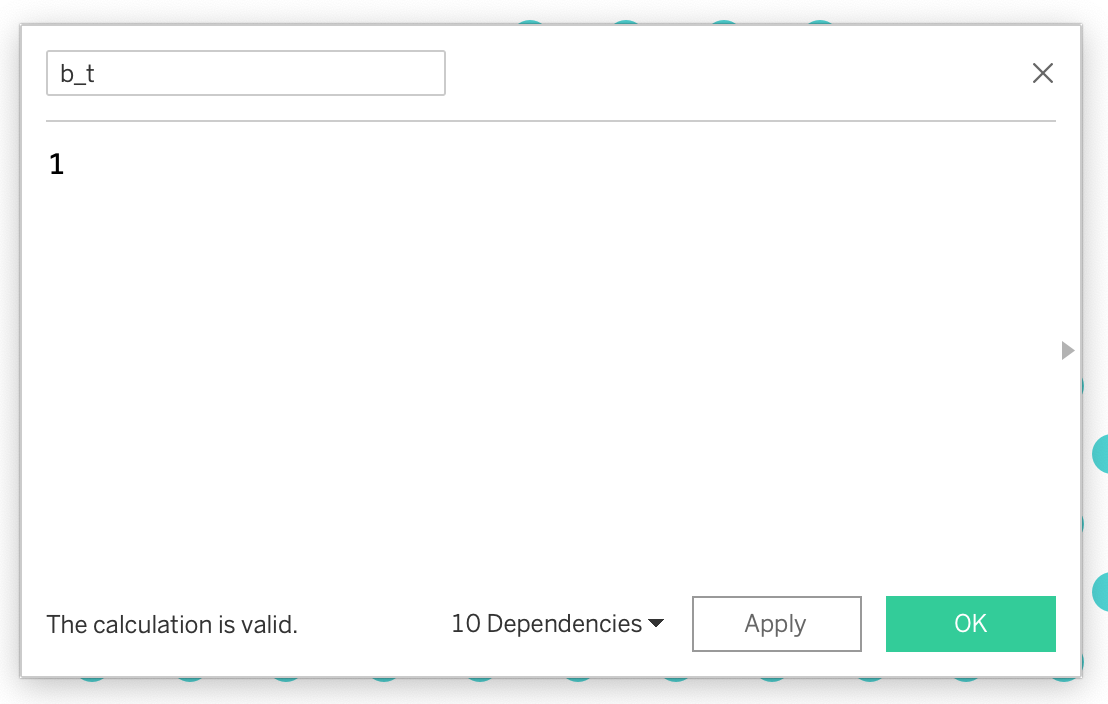
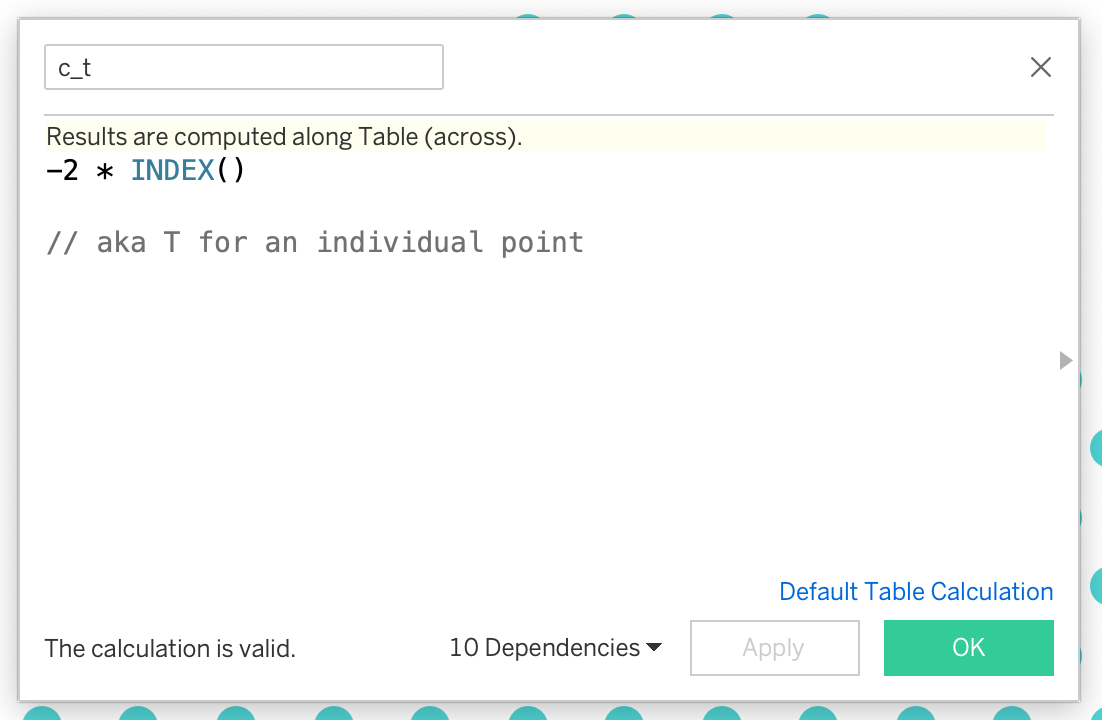
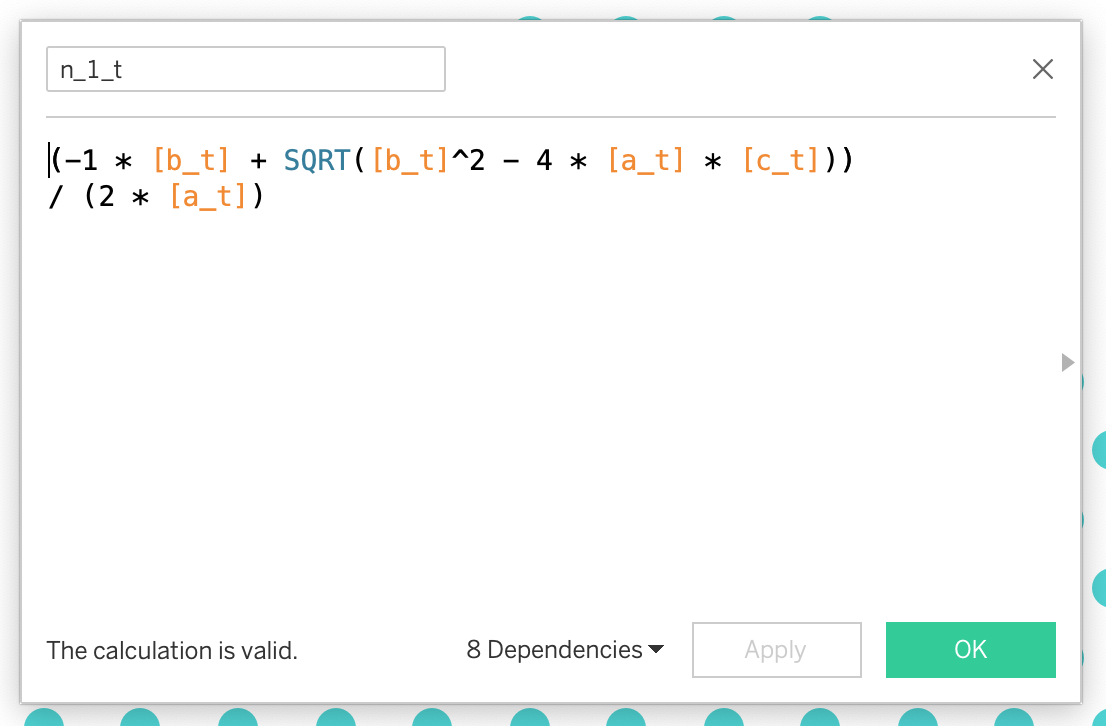
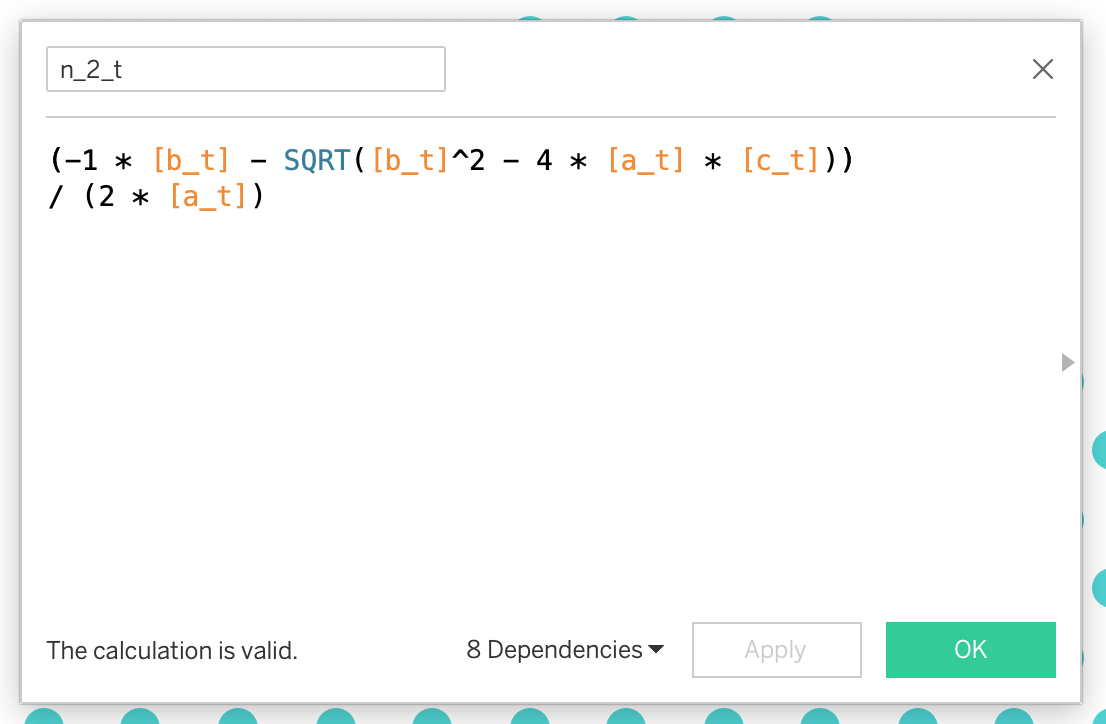
n^2 + n - 2 * T_n = 0We can solve this using the quadratic formula, where a = 1, b = 1 and c = -2T_n (or in our case, INDEX()). Create the following calculated fields:
a_t = 1b_t = 1c_t = -2 * INDEX()n_1_t = (-1 * [b_t] + SQRT([b_t]^2 - 4 * [a_t] * [c_t])) / (2 * [a_t])n_2_t = (-1 * [b_t] - SQRT([b_t]^2 - 4 * [a_t] * [c_t]))
/ (2 * [a_t])n_t = IIF([n_1_t] < 0, [n_2_t], [n_1_t])The good old quadratic formula
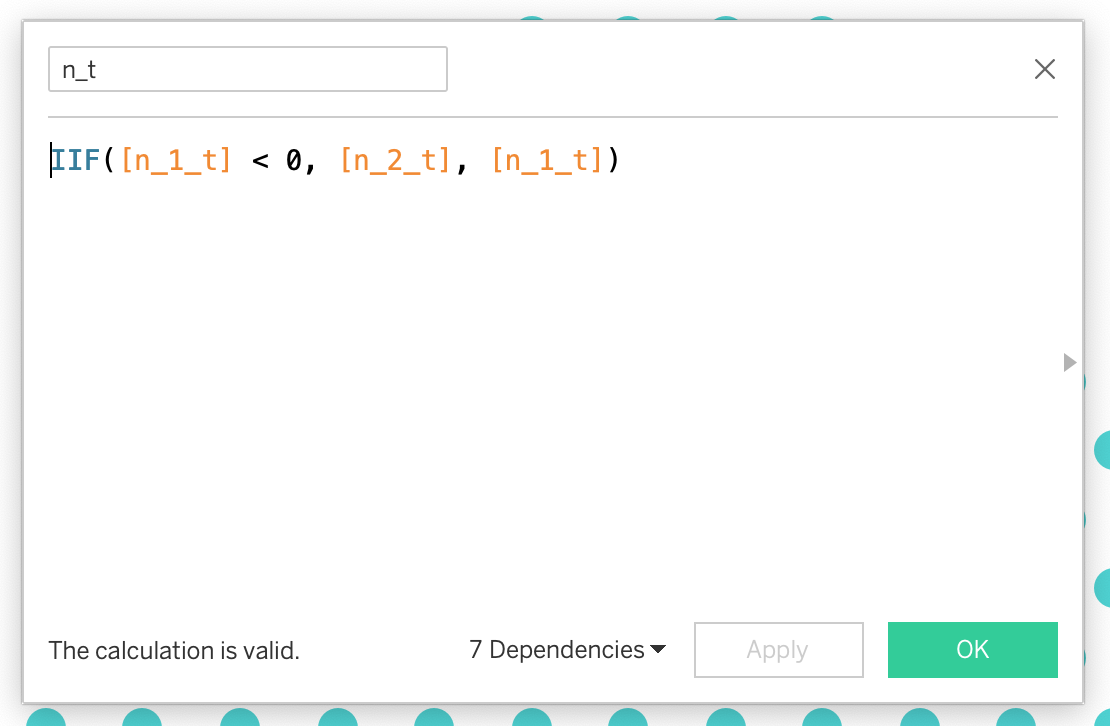
When you add the resultant n_t to our table, you see that for an INDEX() that is not triangular, we get a decimal number, but we need whole numbers for ROWs.
n_t comes out as a decimal number, but we need whole numbers for rows
Well, we have a solution to that! CEILING() is a great function that rounds decimals up to the nearest whole number. But when you try to make ROW use CEILING function with n_t…Tableau won’t let you. “The ‘CEILING’ function cannot be applied to table calculations and fields from multiple data sources”.
“The ‘CEILING’ function cannot be applied to table calculations and fields from multiple data sources”
Not to worry, though, the INT() function works just fine, you just have to do a little conditioning since INT() truncates down instead of rounding up. You can use the following for your [ROW] calculated field:
IIF(INT([n_t]) = [n_t], INT([n_t]), INT([n_t]) + 1)Turning an INT() into a CEILING()
Checking it in our table, this looks great.
We’ve worked out our ROW values from n_t
Next, the COORDs
There’s no great trick to figuring out the coordinates (i.e. x-axis) on this one; since you know what row a point is in, you know how wide the row is. You just need to figure out which point on the row each point is.
To do this, work out the size of a full triangle with (ROW-1) number of rows, and subtract it from INDEX(). Then adjust the x-displacement using ROW/2 (i.e. half a row width) and a constant, until your plot is centered around the x=0 axis.
That was a mouthful…Let’s break it down:
Work out the size of a full triangle with (ROW-1) number of rows
Remember GCSE maths?
T_n = 0.5 * n * (n + 1)…except this time, we’ll use (ROW-1) instead of n.
Formula for calculating a full triangle with ROW number of rows
Subtract it from INDEX() and adjust the x-displacement
Set up a [COORD] calculated field with the following:
(INDEX() - [T]) - ([ROW] / 2) - 0.5Set up the [COORD] calculated field
Again, adding that field to our table looks pretty good.
We’ve built out a table containing all the points and their ROW/COORD locations
Plotting the points on a chart
This next part is pretty much like building a scatter plot, with a couple key differences:
You need to ensure domain padding is on for the [Point (bin)] field
You need to ensure the [Point (bin)] field is on “Detail” on the Marks card
Create a new sheet and turn on domain padding
To do this, drag the [Point (bin)] field onto rows and turn on “Show Missing Values”, same as we did way back at the start of this blog.
Turn on domain padding on a new sheet
Build your scatter plot
Start by moving the [Point (bin)] pill to “Details” on the Marks card - we’ll need it later.
With [Point (bin)] on Details, this chart looks pretty sparse
Next, add [ROW] to rows and [COORD] to columns, both calculating on Point (bin). (If you forget to calculate on Point (bin), your scatter plot will initially be a single point!)
A triangle! Sorta…
To get this looking more like a normal triangle, you can simply reverse the rows axis.
The triangle plot after reversing the rows axis
Recap: Visualizing triangular numbers
Work out the row of each point using the triangular numbers equation
Work out the coordinate of each point in a row, based on the row width
Plot the row and coordinate for each point on a scatter plot, ensuring you have turned on domain padding and added your bins to “Details” on the Marks card
If you made it this far…
If you made it this far, congratulations! You should now be able to create a triangular scatter plot with just a 2-record data set. If you’d like to explore the rest of my Tableau Public viz using this technique, click on the big image at the top of the page, or click this handy link right here. Thanks for reading!


